Welcome to BCEAweb


BCEAweb provides a web interface to the R package BCEA, designed to post-process the results of a statistical model and standardise health economic evaluations, as described in the following graph.

A schematic representation of the process of health economic evaluation
First, a statistical model is constructed and fitted to estimate relevant population parameters (the red rounded box). These are then fed to an economic model (the grey box), which combines them to obtain suitable summaries that quantify the incremental population average for clinical benefits (e.g. QALYs) and costs (e.g. £). These are the fundamental quantities used to make the decision analysis (orange box). And this is the process that BCEA and BCEAweb can perform, by producing standardise output to aid in the assessment of the economic evaluation. In addition, provided suitable data are provided by the user, BCEAweb can also perform Probabilistic Sensitivity Analysis i.e. the process of analysing the impact of (parameter or model) uncertainty on the results of the decision analysis (the olive box).

BCEAweb assumes that the results of the statistical model are available in the form of a large number of simulations for all the relevant model parameters. These can be stored and uploaded by the user using three different formats:
  1. A spreadsheet, in .csv format, e.g. a file produced by MS Excel. Download an example here;
  2. Files in 'coda' format. These are typically saved as the results of running MCMC software such as OpenBUGS. Coda produces an 'index' file and one output file for each Markov Chain used in the analysis. Download a .zip file with an example here.
  3. A R object, available in the current session. This can be a spreadsheet imported in R (e.g. using the 
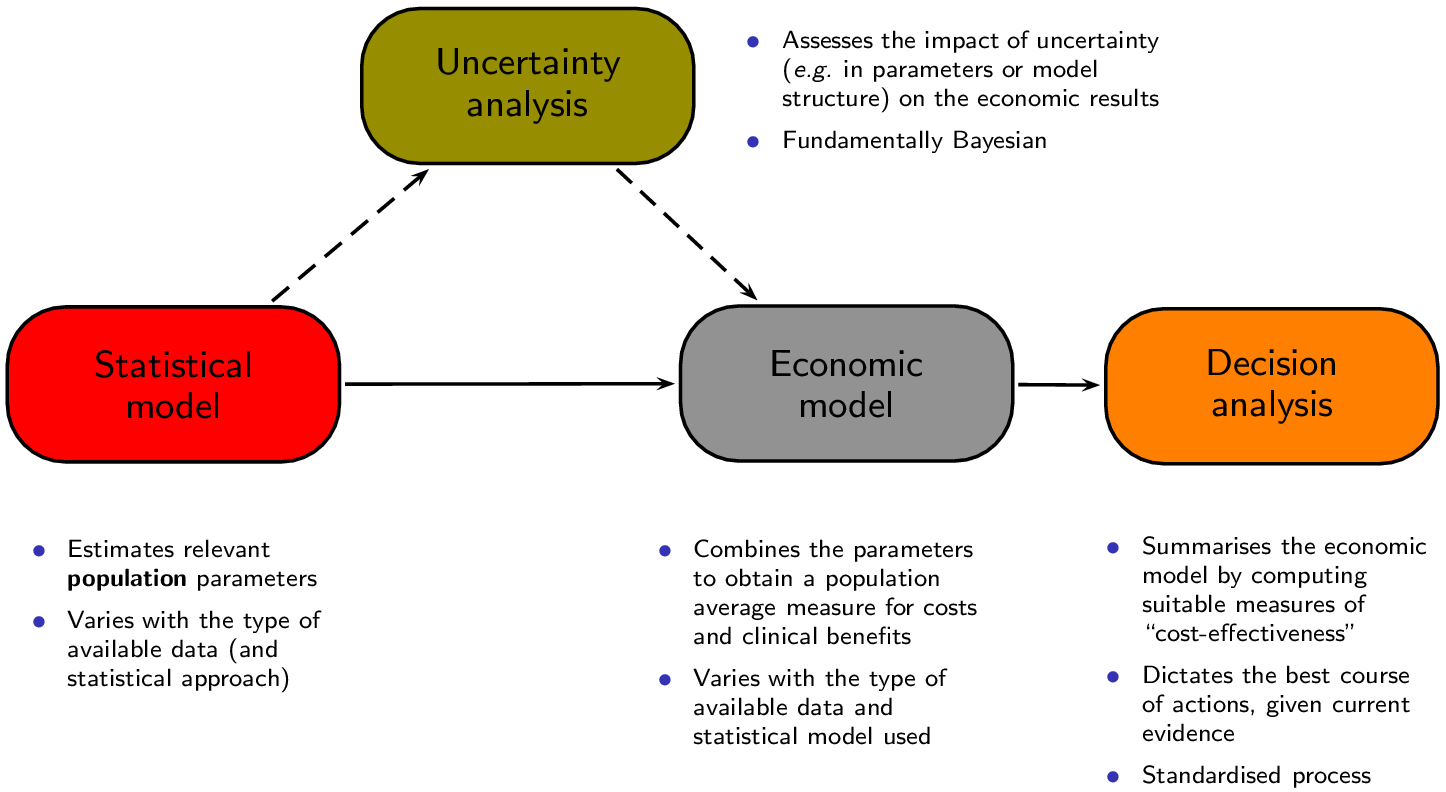
read.csv function). Or the output of a full Bayesian analysis (e.g. performed using OpenBUGS). The resulting data will be pre-processed to eliminate linear dependency across the variables.
The parameters simulations are uploaded at the 'Parameter simulations' tab. Once the simulations are uploaded, BCEAweb will produce graphical summaries and tables so that the user can assess whether the results are consistent with the assumptions or, in the case of a full Bayesian analysis, analysis convergence of the MCMC process through suitable diagnostics. BCEAweb assumes that the user has saved simulations for the measures of effectiveness and costs for each of the interventions being assessed in a .csv file. The order of the variables in this file needs to be like in the following picture (e.g. effectiveness and costs for each intervention, in sequence).


An example of such a file can be obtained here. These simulations are uploaded in the 'Economic analysis' tab, where the user can specify some options. Clicking the button 
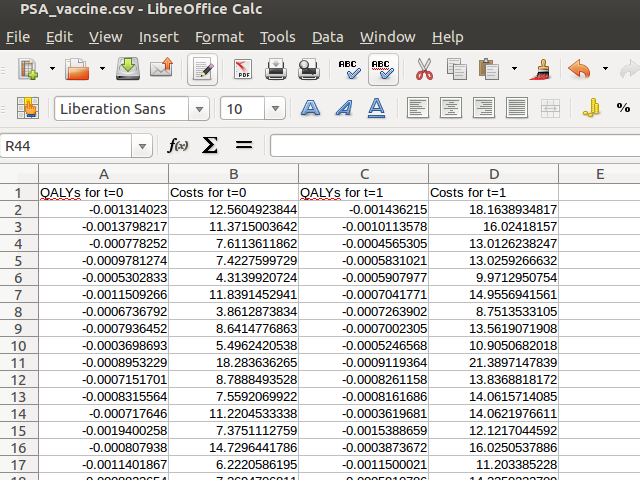
Run the analysis in the 'Economic analysis tab' will run BCEA in the background and create all the relevant economic summaries, including a detailed Probabilistic Sensitivity Analysis. The tab 'Value of information' also automatically computes the Expected Value of Perfect Information and allows the user to run an analysis of the Expected Value of Partial Perfect Information. This is computed using computational efficient methods and provides a valuable tool to assess the impact of current uncertainty on the decision-making process and to determine research prioritisation. Crucially, these methods cannot be implemented in non-specialised software (e.g. MS Excel) and thus the use of statistical programmes such as R, is essential. The results of the economic evaluation performed using BCEAweb can be exported in either .pdf or .doc format. The resulting report contains some pre-formatted text, aimed at guiding the user through the interpretation of the results.


Copyright: Gianluca Baio, Polina Hadjipanayiotou, Andrea Berardi, Anna Heath

NB check visually if the Bayesian model has converged

Check visually the value of the Gelman-Rubin statistic. Values below 1.1 are considered to suggest convergence for a given parameter